
For single-tenant net-lease dollar stores — characterized here as freestanding Dollar General, Dollar Tree and Family Dollar properties — second-quarter 2017 cap rates edged up 10 basis points (bps) year-over-year to reach 6.75%, according to national net-lease advisory firm The Boulder Group.
Improved returns in the second quarter reflect a mixed performance, however. The Boulder Group reports that Dollar General cap rates rose 15% year-over-year and Family Dollar cap rates increased 20% year-over-year, while Dollar Tree cap rates fell 10% year-over-year.


The median asking price for a net lease retail space tenanted by Dollar General was $1.284 million, or $141 media price per foot. For Family Dollar Stores, the median asking price was $1.417 million, with a median price per foot of $170. In the case of Dollar Tree, the median asking price in the second quarter of 2017 was $1.788 million, as the median price per foot hit $172.
Net-lease dollar store tenants underwent an expansion phase in the second quarter, and the advisory firm contends than an “aggressive pace” of expansion is expected to continue this year. Supply of single-tenant dollar stores recorded in second-quarter 2017 had increased 34% year-over-year, according to The Boulder Group, and new construction accounted for 57% of all store supply in the second quarter. Institutional portfolio buyers “limited” their purchases of net lease dollar store assets in the second quarter, the firm says, and the pullback is another contributing factor in elevated supply levels.

Nevertheless, the sector outlook for the year looks positive, as higher yields should continue to draw in investors. Although The Boulder Group says that dollar store expansion plans will keep supply saturated, investors interested in taking advantage of full lease terms will drive a majority of demand for new assets. When compared to the total net lease retail market in the second quarter, dollar stores priced at a 52 bps discount. In the same period last year, this discount priced at 47 bps.
“Dollar stores continue to garnish demand from all investor classes as they provide viable alternatives to other net lease assets that can be acquired with long term triple net leases priced below $2 million,” The Boulder Group said in its research.
By tenant, Dollar General stores held the majority of the market in the second quarter, comprising 70% of all net lease dollar stores. Next came Family Dollar, at 24% of market supply. Dollar Tree stores held just 6% of market composition, according to the firm.
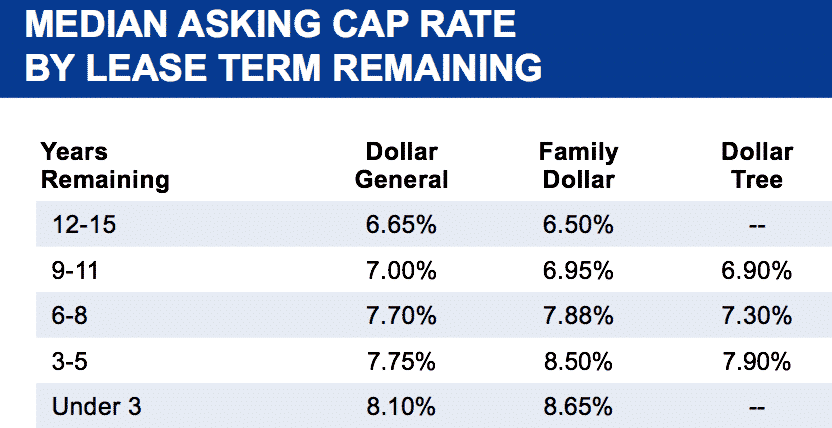
Below are regional second-quarter net-lease dollar store cap rates compiled by The Boulder Group.